The BESS Procurement Trap: What Buyers Cannot See in a Battery Datasheet
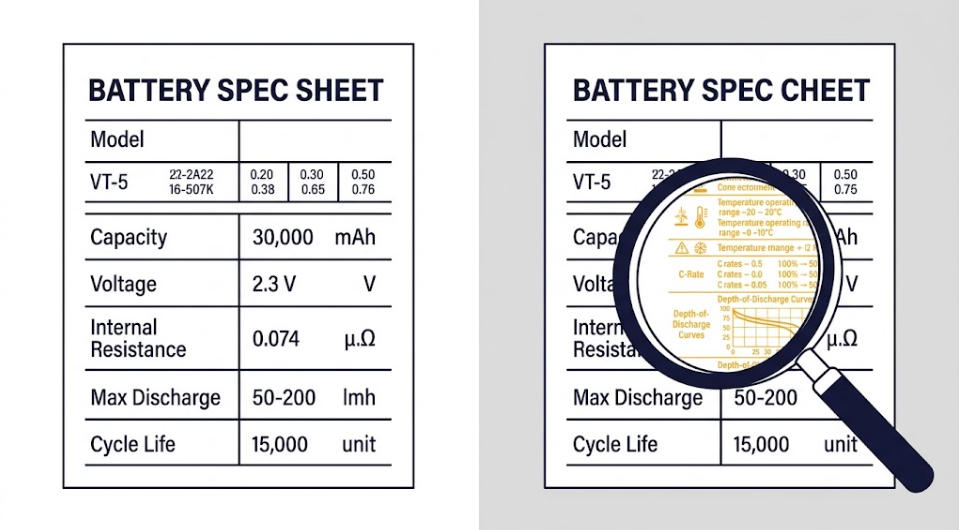
Every BESS procurement process starts the same way: a stack of datasheets, a spreadsheet, and a side-by-side comparison of headline numbers. Cycle life, round-trip efficiency, energy density, and warranty years all look precise, and precision feels like due diligence. But a datasheet is a marketing document as much as a technical one. It reports the best result a manufacturer could produce in the lab, not the result a specific project will get. That gap is where BESS procurement mistakes happen, and buyers rarely catch it before they sign the contract.
| QUICK ANSWER A battery datasheet reports lab-tested numbers. Cycle life uses a fixed temperature and depth of discharge. Efficiency reflects beginning of life. Warranty terms come with narrow operating windows. Real BESS procurement risk lives in the gap between those lab conditions and a project’s actual climate, duty cycle, and contract obligations. |
Why BESS Procurement Numbers Rarely Survive Contact With a Real Site
Manufacturers test cells and packs under conditions chosen to produce the best defensible number, not the most representative one. They usually generate a cycle life figure under three fixed conditions. These are a stable ambient temperature near 25°C, a moderate discharge rate, and a set depth of discharge. Change any one of those inputs, though. A hotter climate, a faster discharge rate for demand response, or a deeper daily swing all move the real number. None of that is dishonest. It is simply how component testing works, in batteries as in any other engineering product. The problem is that most BESS procurement teams read the headline number as a promise, not a starting point. Then they build a financial model on top of it.
The Cycle Life Number BESS Procurement Teams Get Wrong
Cycle life counts the full charge-discharge cycles a battery can complete before capacity falls to a defined end-of-life threshold. That threshold is commonly 80% of original capacity, or 70% in some industrial contracts. On its own, that number is close to meaningless. A pack rated for several thousand cycles at a shallow depth of discharge and a gentle rate looks strong on paper. Run that same pack at a deep daily swing in a hot climate, though, and it can lose a large share of that rated life.
Field data backs this up. Monitored lithium-ion storage systems show real-world round-trip efficiency and capacity behavior that diverge from vendor projections once ambient temperature and cycling profiles enter the picture. See the National Laboratory of the Rockies’ utility-scale battery storage cost and performance data for the assumptions the BESS procurement industry benchmarks against.
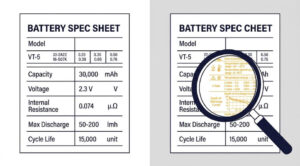
Before accepting any cycle life claim, ask for the depth of discharge, C-rate, ambient temperature, and end-of-life threshold behind it. Then convert that number to your own duty cycle. For chemistry-level nuance — especially calendar aging versus cycle aging — a line-by-line battery spec sheet walkthrough is worth reading before comparing two quotes.
Round-Trip Efficiency Depends on Where You Measure It
Round-trip efficiency is not one number; it is at least two. DC round-trip efficiency, measured at the battery’s own terminals, typically runs in the low-to-mid 90s percent range for LiFePO4 packs. AC round-trip efficiency works differently. Measured at the meter, it includes the power conversion system, auxiliary loads, and thermal management, and usually lands several percentage points lower. A datasheet that quotes only the higher DC-side number is not lying. It just is not describing what shows up on a customer’s utility bill.
Efficiency also degrades with age and temperature. The National Laboratory of the Rockies, the renamed National Renewable Energy Laboratory, has field-monitored grid-connected lithium-ion storage. Its data shows monthly round-trip efficiency running below the commonly cited 85% average during cold-weather charging periods. Internal resistance and thermal losses drive that gap, and a beginning-of-life datasheet number does not capture either effect. In a BESS procurement comparison, confirm which efficiency figure a vendor is quoting: AC or DC, beginning-of-life or averaged over the warranty term. Only then should you treat two numbers as comparable. For the full formula, worked examples, and a round-trip efficiency calculator, it is worth running your own quoted numbers through the math before you sign.
Nameplate Capacity: The Number Every BESS Procurement Bid Leads With
Every BESS datasheet leads with a nameplate energy figure — 100 kWh, 5 MWh, whatever the container’s rating happens to be. That number describes what the cells can physically hold, not what a buyer can actually use. Usable energy is nameplate capacity multiplied by the operating depth of discharge, and the difference is rarely small. A system run on a 10–95% state-of-charge window to protect cell longevity already gives up 15% of its nameplate before day one. A more conservative 20–80% window gives up 40%.
This matters in BESS procurement because two suppliers can quote the same nameplate capacity at the same price. Yet they can deliver very different usable energy once you apply each one’s SOC window and beginning-of-life losses. Picture a 1 MWh system quoted at a wide 5–95% window and 95% round-trip efficiency. It delivers meaningfully more usable throughput on day one than the same 1 MWh nameplate at a narrower window and lower efficiency. That gap only grows as both systems age toward their end-of-life threshold.
Buyers who size a project against the nameplate number, instead of the usable-energy figure at the contracted SOC window and efficiency, take on real risk. The system can end up undershooting the load it needs to serve. Always ask for the usable kWh or MWh figure at the proposed SOC window, not the headline nameplate number. Also ask how that figure changes at the contracted end-of-life threshold. A dedicated guide to SOC limits and the 20/80 rule explains how these windows get chosen and why they vary by chemistry. It is useful background before comparing nameplate quotes across vendors.
Temperature Derating: The Line Most Buyers Skip Past
Datasheets publish an operating temperature range, and most buyers glance at it and move on. That range hides two separate problems. First, capacity and power both derate outside a narrow comfort band. A system rated for full output at 25°C will not deliver the same power, or the same usable capacity, at 45°C ambient. Cooling system design — air-cooled versus liquid-cooled — determines how steep that derating curve gets. Second, and more seriously, charging a lithium-ion cell below 0°C risks lithium plating on the anode. That damage is permanent; no BMS can undo it after the fact. Sustained operation above roughly 45°C brings a separate risk, since it accelerates electrolyte breakdown and shortens calendar life.
Real seasonal swings change this picture — a cold-climate installation, a rooftop unit with limited shading, a container without active thermal management. In each case, the datasheet’s headline power and capacity numbers describe a best case. The system will only hit that best case for part of the year. This is a common BESS procurement blind spot. Ask for a derating curve across the full operating temperature range, not just the single 25°C figure. Confirm whether the quoted cycle-life and efficiency numbers already assume your site’s climate, or a controlled lab environment instead.
The Warranty Question Every BESS Procurement Contract Must Answer
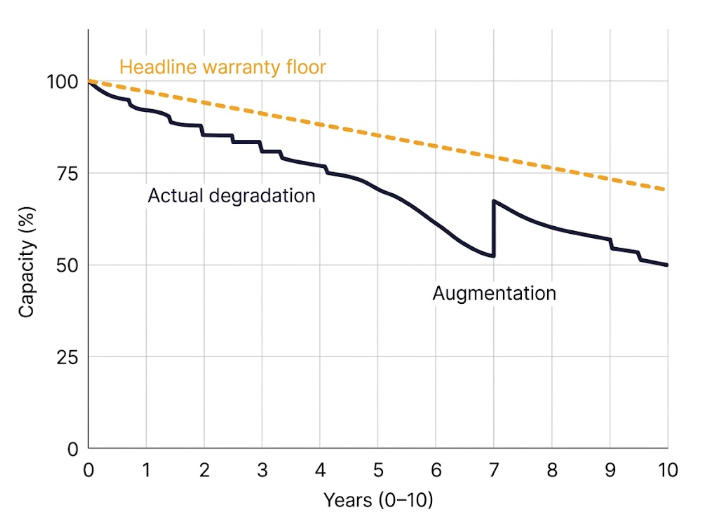
“10-year warranty” is not a specification. It is a headline, and a real BESS procurement contract needs several numbers behind it. Start with the beginning-of-life capacity and the guaranteed end-of-life capacity. Add the annual degradation curve connecting the two, plus the depth-of-discharge and temperature envelope the guarantee assumes. Round it out with the throughput allowance, if any, and the method used to measure state of health for a claim.
Third-party reviewers who audit these contracts for lenders make the same point. They judge a capacity warranty on more than the degradation curve itself. How suppliers measure that curve, and what operating restrictions apply, both matter before it stays valid. Two systems can both carry a “10-year, 70%” warranty on the cover page. Once you compare the fine print, they can represent very different risk.
Augmentation is the other half of this problem. Contracts guarantee degradation against a curve, not a fixed capacity. Most long-duration deals assume periodic augmentation as a result, adding new capacity to keep the system above a contracted floor. If a BESS procurement contract leaves that augmentation plan unpriced and unscheduled, the buyer inherits an open-ended future cost. This issue deserves its own review before signing, rather than a line item buried in an appendix.
Response Time and Ramp Rate: Tested Under Ideal Conditions Too
For any BESS procurement targeting frequency response, demand charge management, or other fast ancillary services, response time and ramp rate matter most to buyers. They are also the specification least likely to survive real grid conditions unchanged. Vendors typically measure a quoted sub-second response time in a controlled test rig with a clean step-change signal. Real interconnections produce noisy, continuously fluctuating frequency and voltage instead. Communication latency between the BMS, the energy management system, and the grid interface also eats into that number. A component-level datasheet does not show this. It describes the battery and inverter alone, not the full control stack a specific project will actually run.
Before treating a response-time or ramp-rate figure as contract-ready in a BESS procurement bid, ask where the test happened. It matters whether the answer is the cell, the inverter, or the point of interconnection. Also confirm whether the test included the full communication and control chain the project will actually use. A number that looks identical to a competitor’s on paper can behave very differently once real telemetry, protocol overhead, and grid noise enter the picture.
The BMS Line Item BESS Procurement Teams Skip
Most BESS procurement teams spend hours comparing cell chemistry, capacity, and cycle life. Then they spend only a few minutes on the battery management system. That imbalance is a mistake. The BMS, not the cell, determines whether a pack actually reaches its rated cycle life in the field. It also determines whether the pack fails safely when something goes wrong. Cell-balancing strategy, current-limiting behavior, and communication reliability are all difficult to verify from a spec sheet. Different suppliers can quote the same headline protection thresholds while implementing them in very different ways. A structured BMS evaluation belongs in the same procurement stage as the cycle life review, not after you sign the contract. Ask for the balancing method, fault logs, and communication protocol documentation from an existing deployment.
Certifications in BESS Procurement Confirm a Test Was Passed — Not How Much Margin Existed
UL 9540A, IEC 62619, IEC 62933, NFPA 855, and UN 38.3 are baseline documents any serious BESS procurement bid should include. Their absence is a legitimate red flag. But a pass/fail certificate does not show how close the system came to failing. It also does not confirm whether the certified configuration matches what will actually ship.
For utility interconnection and insurance underwriting, UL 9540A documentation is increasingly a hard requirement, not a nice-to-have. Confirm that the test covered the exact model and enclosure in your quote, not an earlier or larger variant of the same product line. A closer read of the full specification sheet, certifications included, catches most of this category of surprise before you sign a purchase order. A guide to battery cycle standards covers how vendors are supposed to test and report the same headline numbers. It makes a useful companion checklist for anyone building an RFQ.
A BESS Procurement Interrogation Checklist Before Signing
- Cycle life: ask for depth of discharge, C-rate, ambient temperature, and end-of-life threshold behind the headline number.
- Usable energy: ask for the usable kWh/MWh figure at the proposed SOC window and beginning-of-life efficiency, not just the nameplate number.
- Efficiency: confirm AC vs. DC measurement point and whether the figure is beginning-of-life or averaged over the warranty term.
- Temperature: request a derating curve across the full operating range, not just the 25°C headline figure, especially for cold- or hot-climate sites.
- Response time: confirm the test covered the point of interconnection, including the full communication and control chain.
- Warranty: request the full annual degradation curve, not just the year-10 floor, plus the measurement method used for a claim.
- Augmentation: get a priced, scheduled augmentation plan attached to the warranty curve, not a verbal assumption.
- BMS: request balancing method, communication protocol, and field fault-log history from an existing site.
- Certifications: confirm the lab tested UL 9540A (or the IEC/NFPA equivalent) on the exact model and enclosure you are quoting.
Frequently Asked Questions About BESS Procurement
Why do BESS cycle life claims differ so much between suppliers?
Because the underlying test conditions differ. A rating of several thousand cycles at a shallow depth of discharge and mild temperature tells a different story than the same cycle count at high heat and full depth of discharge. Both can appear on a datasheet as the same headline number, even though the real-world outcome differs sharply.
Is AC or DC round-trip efficiency the more useful number for a buyer?
AC round-trip efficiency, since it includes the power conversion system and auxiliary loads and reflects what actually shows up on a meter. DC efficiency is useful for comparing cell-level performance but overstates real system output.
Why does usable capacity matter more than nameplate capacity?
Nameplate capacity is what the cells can physically hold, not what a project can actually draw on. The SOC window and beginning-of-life losses set the real usable figure. Two suppliers quoting the same nameplate number at the same price can deliver very different usable energy once you apply those factors.
What is the single biggest datasheet blind spot in BESS procurement?
The warranty degradation curve. A headline year count and end-of-life percentage is not enough on its own. Without the annual curve, measurement method, and operating envelope in between, a buyer cannot model real lifetime value.
Should a missing certification always disqualify a bid?
Not automatically, but it should trigger a direct question. Some certifications are jurisdiction-specific or still in process; a credible supplier can explain the gap and give a firm timeline rather than just an assurance.
How much does climate actually change a datasheet’s numbers?
Enough to matter in a financial model. Cold-climate charging below freezing risks lithium plating and permanent capacity loss. Sustained heat above roughly 45°C accelerates electrolyte breakdown instead. Both effects sit outside the single 25°C figure that most headline specs use.
Key Takeaways for BESS Procurement Teams
A battery datasheet is a starting point for BESS procurement, not a finish line. The numbers on the page are real, but they describe a lab result under conditions a buyer’s own site will rarely match exactly. The projects that avoid expensive surprises share a pattern: their teams convert headline numbers into their own duty cycle and climate. They size against usable energy rather than nameplate capacity. They request the full warranty curve instead of the year-10 floor. They also give the BMS and certification package the same scrutiny as the cell chemistry. That discipline costs a few extra weeks of due diligence. Skipping it costs far more, usually starting around year three.
Further Reading
How to Read a LiFePO4 Battery Spec Sheet: A Buyer’s Line-by-Line Guide
Understanding BESS Specifications: The Complete Guide
How to Evaluate a BESS Supplier’s BMS
Battery Cycle Standards: DoD vs. SOH vs. EOL
BESS Augmentation: The Complete Guide to Restoring Capacity Lost to Degradation
BESS Round Trip Efficiency (RTE): How to Calculate Efficiency (With Calculator)
20/80 Rule for Batteries: SOC Limits Explained for BESS
National Laboratory of the Rockies — Utility-Scale Battery Storage Cost and Performance (ATB)